Real Time Monitor Function guide

This document describes Real Time Monitor function
1. Opening method
There are two methods to start the Realtime Monitor Function.
1.1. Realtime Monitor Function from GX Works Tool menu
To start monitoring of PLC controller open Tool->Real Time Monitor Function from menu bar:
1.2 GX Log Viewer
Choose connection target (CPU, simulator or logging module) and click Show Current Device/Label status:
Specify simulator system number/CPU
1.3. Connection destination change
Connection options are also available in Online->Realtime Monitor:
2. Monitoring data
2.1 Realtime Monitor Setting
To choose devices for monitoring go to the Realtime Monitor Settings. When the Realtime Monitor is started from GX Works, the setting windows start automatically.
In Monitor Target Setting you can set devices from CPU memory or buffer memory. It's possible to write and read configuration files.
In case of RCPU, you can also read labels. Click Read GXWorks3 Project, choose project file (Read GX Works3 Project) and select Specify Label option:
2.2. Monitor Condition Setting
In Monitor Condition Settings you can set Timing type (default is Each scan) and trigger type:
3. Graph operation
3.1 Navigation
There are some useful navigation switches:
1. Start/ stop monitoring
2. Graph alignment and superimpose
3. Multiple cursor - useful for time measurement
4. Graph autoscale
5. Cursor value
3.2 Graph size options
Scaling graph
Moving graph
Time scale setting
Specifying the upper/lower bounds
-Manually by clicking on the bounds value:
- Graph operation -> Change Upper/Lower bound/Y Axis Scale in Batch:
3.3 Save and read graph data
Use File->Save As option to save graph (as Unicode Text File or Image file). To read graph use Open Option:
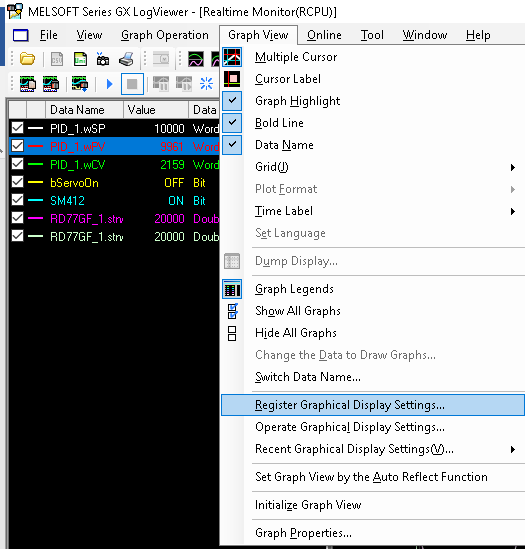
3.4 Save and read the graphical display settings
The graphical settings (scaling, bounds) are not saving automatically with the logging file. To save the graphical settings use Graph View -> Register Graphical Display Settings...
To read the graphical display setiings use Operate Graphical Display Settings option:
3.5 Import/Export graphical display settings
Open File->Import and Export. Chose import/Export Graphical Display Settings and specify file. It's impossible to export particular grapical display settings.
3.6 Time and difference measurement example
Set the Multiple Cursor option and move both blue and red cursor:
Expand the time scale and set the cursors precisely:

right mouse button-> Move Red/Blue Cursor Here:
Read the difference value (Difference (Blue->Red) or time (Span (Blue->Red).
Related Articles
Determination of PID parameters using table method
W dokumencie opisane są tabelaryczne metody doboru nastaw w oparciu o model inercyjny pierwszego rzędu. Parametry modelu wyznaczane są z użyciem narzędzia Realtime Monitor Function Summary: This document describes PID tuning using step response ...Real Time Monitor - tool to monitor devices
This video shows full approach to Real Time Monitor - tool that allow you to monitor devices in real time.GX Works3 - iQ-F - Function blocks for converting LREAL/REAL data type
This article contains description of two function blocks for iQ-F CPU that convert LREAL to REAL data type and REAL to LREAL data type 1. LREAL2REAL - function block that converts two-element array of double words (unsigned) to float data type In/Out ...iQ-F PWM outputs controler for PID temperature regulation
This article describes the function block to control heating/cooling outputs with PWM for temperature control using PID Ten artykuł opisuje blok funkcyjny do sterowania wyjściami grzania/chłodzenia wykorzystując PWM dla kontroli temperatury poprzez ...iQ-F and iQ-R firmware update procedure
In this video you can see how to update firmware in iq-F, iq-R and modules via SD card or dedicated function in GX Works3 software.